Tramway and Short-Term Rentals
by Bernardo & Martina
The renewed focus on sustainable transport has led Florence to revive a a service that, in the 1800s, even extended to suburban areas: the tram. Florence’s tramway network was initially built in the late 19th century, heavily damaged during World War II, and fully restored in the 1950s. However, due to a lack of modernization, the service became inadequate and obsolete, leading to its permanent discontinuation in 1958.
In the early 2000s, the municipality of Florence decided to restore the tramway as an alternative to road transport. The first line of the new network began operation in 2010, despite opposition: in 2008, a referendum asked citizens whether they supported the construction of the first tram line in the city center, and the “No” vote prevailed.
Nevertheless, two tram lines (or “tramvia,” as Florentines call them) have been built, and the network continues to expand. Plans are underway to enhance the existing lines and construct three additional ones.
In a tourist-heavy city like Florence, I’ve often heard people suggest that the opening of new tram lines near their homes correlates with the emergence of new short-term rental accommodations. This association seems logical: the ease of accessing tourist areas by tram could incentivize choosing locations near tram stops for tourist accommodation businesses.
Can we verify this hypothesis with data? Demonstrating a causal link between the two phenomena is complex, but we can at least explore whether there is any correlation. Let’s begin by examining two key data sources:
- Data from Inside AirBnb for the municipality of Florence, from which we select only “listings” with first review in 2025 (to represent recently opened Airbnbs).
- Data provided by the Tuscany Region on Florence’s tramway network. This data is in GTFS format and easily allows us to obtain the location of tram stops.
We also incorporate additional data to assess the potential relationship between tram stops and new Airbnb openings:
- Population data, extracted from the “Kontur Population: Global Population” dataset which provides an H3 hexagonal grid with 400m sides. Each hexagon has the resident population in 2023 associated with it.
- OpenStreetMap data on tourist attractions, collected using the Overpass API.
We will use H3 hexagons as our unit of analysis.
Population and tourist attractions are introduced as potential confounding factors. We expect both Airbnbs and tram stops to be predominantly located in areas with high population density and tourist interest, which could amplify any correlation between them.
Some Maps
Let’s start by visualizing the new listings in 2025 on a map:
New listings are predominantly concentrated in the city center, where many tram stops are also located. Distance from the center appears to be a significant factor, with new openings becoming rare as the distance increases.
Next, let’s visualize the population distribution:
The tram lines primarily serve areas with high population density, but only in the western part of the city. Construction for the line serving the eastern part is still ongoing.
Finally, let’s examine tourist attractions:
Tram stops connect areas with many tourist attractions, though not the most central areas with the highest concentration. This is partly due to the 2008 referendum, which initially proposed a network passing near the Duomo. The plan was revised after the referendum’s defeat.
Correlations
Let’s analyze how these variables correlate. For each pair, we calculate the Spearman Correlation Coefficient (denoted as r in the figure), which indicates whether two variables have a linear or non-linear correlation. A coefficient of 0 (or statistically insignificant) suggests no correlation, while a coefficient of 1 (-1) indicates a perfect (anti)correlation.
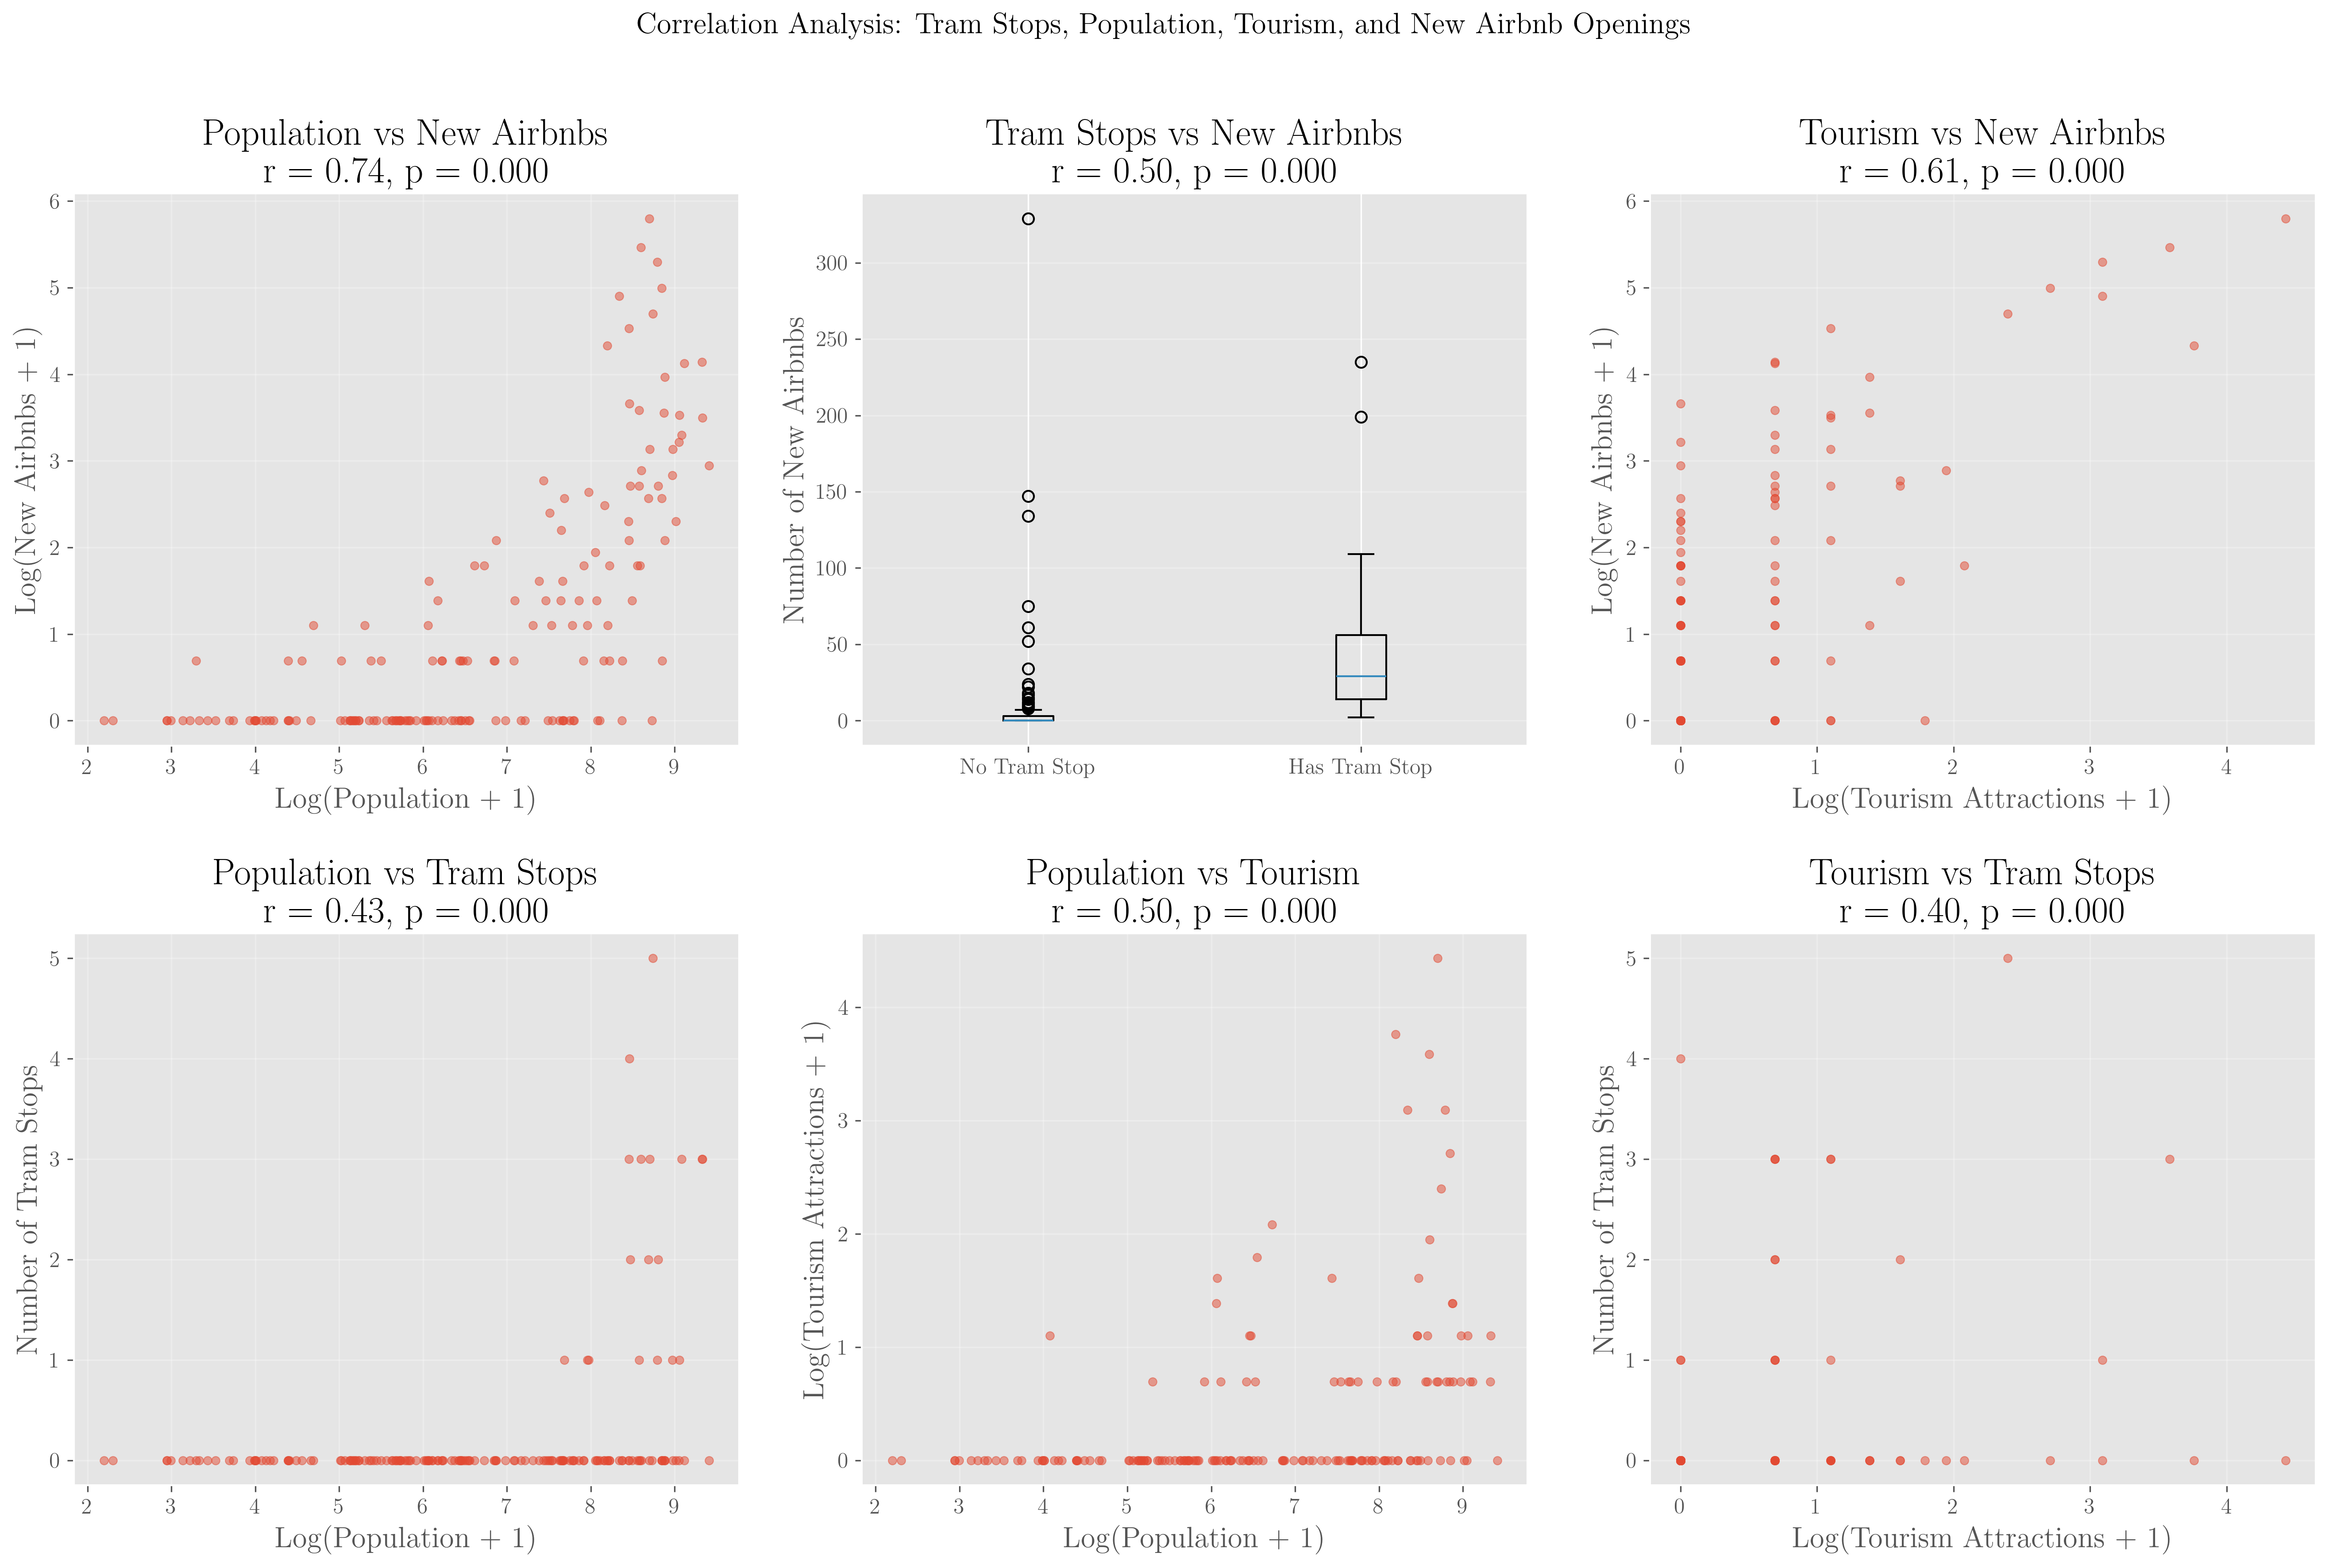
All variables are positively correlated:
- First row: The presence of new Airbnbs correlates with all variables, most strongly with population density (r = 0.74). This value may not be closer to 1 due to the historic center, which is less populated but has more new Airbnb openings.
- Second row: Weak correlations exist between the remaining pairs. Notably, the correlation between population and tram stops is weak, as tram stops are currently only in high-population areas in the western part of the city. Many high-population areas in the east are not yet served but will be included in future expansions.
Could tram stops be attracting new Airbnb openings? To test this, we use Partial Correlation, which adjusts the correlation between two variables while accounting for their relationships with control variables. Here, we examine the correlation between new Airbnbs and tram stops in a hexagon, controlling for population and tourist attractions:
| Correlation | Value | P-value |
|---|---|---|
| Spearman Correlation | 0.50 | 0.000 |
| Partial Spearman Correlation (Population) | 0.30 | 0.000 |
| Partial Spearman Correlation (Tourism) | 0.35 | 0.000 |
| Partial Spearman Correlation (Population+Tourism) | 0.23 | 0.000 |
The correlation persists even after controlling for population, tourist attractions, and their combination, though it weakens. This suggests that the intuition of some citizens, that the tramway stimulates new Airbnb openings, may have some basis. However, further controls and causal analysis would be needed for a more robust conclusion.
Data
The data presented in this post, including counts of new Airbnbs, tram stops, and population in H3 hexagons, is available here.
Subscribe via RSS