Airbnb: the market is concentrating, but Rome is an exception
by Bernardo & Martina
As we observed in a previous post the distribution of Airbnb apartments in some major Italian cities is concentrated in the hands of a few hosts who own many, at least in recent times. Wanting to delve deeper into the issue, we wondered if this situation has been like this for a long time and how it has changed over time (at least since we can observe thanks to data collected by Inside Airbnb).
The Gini index over time
As we previously explained, the Gini index (or coefficient) measures the wealth inequality of a population and can be used to measure how much listings are concentrated in the hands of a few hosts. An index close to 0 would indicate that all hosts own the same number of listings, and the extreme case of an index equal to 1 would indicate that a single host owns all the listings. Its trend over time can give us an indication of how the market is changing: if many small owners are increasingly dominating the market we expect this to decrease; conversely, if it is growing then it is probably agencies and vacation rental groups that are increasing in weight.
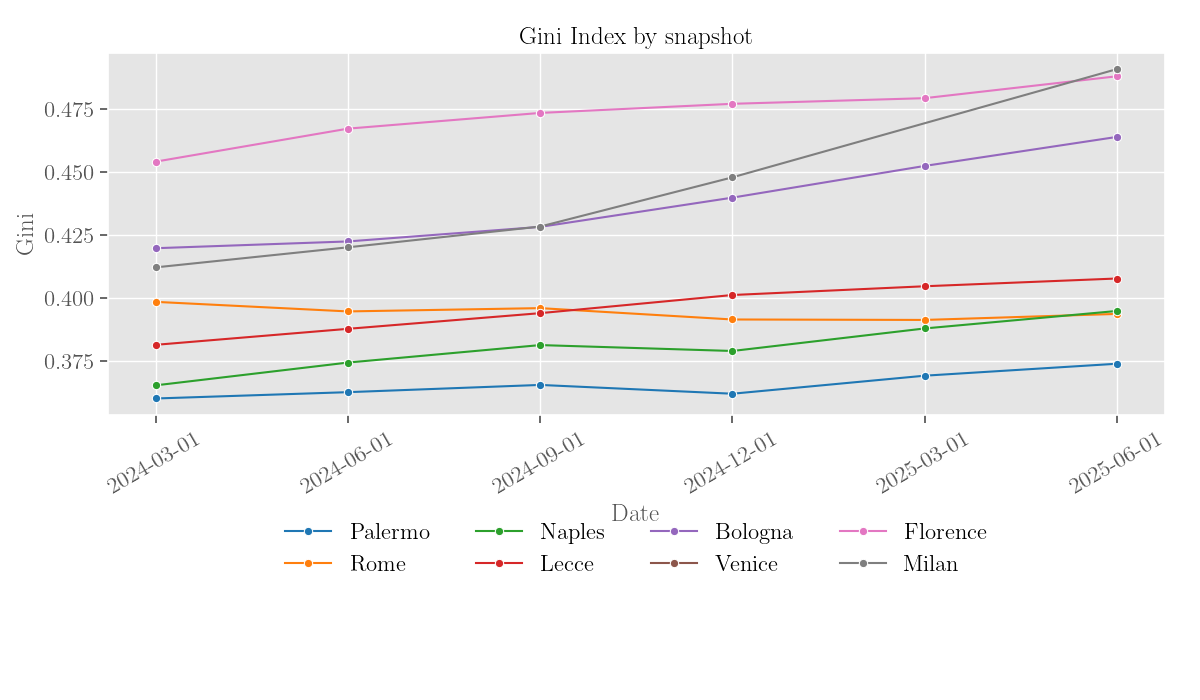
As we can see from the figure, the second scenario applies to 5 of the 6 cities observed, with the only exception being the city of Rome. In the other cities, however, we observe a growth in the Gini index. What does this mean more concretely?
Some simpler numbers
To measure something more interpretable than the Gini index, we can see how many listings belong to hosts who have only 1 and how this number has varied from the first to the last data sample in our possession. We expect these to be the listings that fall into what was the original idea of Airbnb: adding supply to the temporary accommodation market, making available “excess” listings (unused rooms or apartments) from small owners.
In the following table you can see how the percentage of listings that belong to this category was already a minority at the beginning of 2024 and has decreased in about a year and a half. For example, in the city of Bologna this percentage decreased by 5 points, while in Milan by as much as 8.
| City | Num. of listings (Feb 2024) | % 1-listing hosts (Feb 2024) | Num. of listings (Jun 2025) | % 1-listing hosts (Jun 2025) |
|---|---|---|---|---|
| Bologna | 4491 | 39 | 4555 | 34 |
| Florence | 11172 | 33 | 13043 | 30 |
| Lecce | 2047 | 37 | 2213 | 35 |
| Milan | 22106 | 45 | 22540 | 37 |
| Naples | 9943 | 38 | 10669 | 34 |
| Palermo | 6723 | 39 | 7600 | 37 |
| Rome | 30318 | 38 | 36309 | 40 |
Another interesting point of reflection comes from the total number of listings in the two periods: no significant variations are observed. The picture this seems to suggest is that, in the time frame from early 2024 to mid-2025, there have been no expansions or contractions of supply but only concentration towards large hosts.
Rome is again the only city that is an exception: in the same period the total number of listings increased by about 6000 units, and the percentage of listings in the hands of hosts with a single listing increased by 2 points. We don’t have an explanation for this peculiarity at the moment, what do you think? See you next time!
Data
The data used in this post, with the listing counts by host in each scraping run date can be found here.
Subscribe via RSS