Who owns the most Airbnbs in Italian cities?
by Bernardo & Martina
After investigating how short-term rental properties on Airbnb in Florence grow over time, in this post we ask the question: “how unequal is the city in terms of who owns these properties?” and we make comparisons with other cities, staying for the time being within the borders of Italy.
The Gini Index
In economics, the Gini index (or coefficient) is used to measure inequality in the wealth distribution of a population. It’s a classic indicator, expressed as a number between 0 and 1 - a completely egalitarian society, where all people own the same percentage of wealth, has a Gini equal to 0, which increases the more separation is generated between those who own much and those who own little. Our World in Data has beautiful interactive graphics on Gini by country and you can see that among the most striking cases of inequality we have South Africa, for obvious reasons due to colonialism and Apartheid. The indicator takes its name from Corrado Gini, who was an (Italian) economist active in the first half of the 20th century, known for his contributions in economic statistics and demography.
We want to use the Gini index to measure how unequal a city is in terms of who owns how many Airbnb properties - the more tourist accommodations are concentrated in the hands of a few hosts, the closer this indicator will approach 1.
The data presented in this post, with counts of Airbnbs per each host, separated by city and named with the scraping run date, are available here.
As before, we use data from Inside Airbnb which performs regular scraping of Airbnb and we consider the 8 Italian cities for which we have data: Milan, Florence, Rome, Bologna, Venice, Lecce, Naples, Palermo. Data also exists for Bergamo but we excluded it because we prefer to use regional capitals and/or cities that we expect to be very touristy (and have always been); note that while all other cities are provided by Inside Airbnb as standalone, Palermo and Lecce exist within the files of (respectively) “Sicily” and “Puglia”, regions that are evidently pulled down in their entirety in the scraping, likely because their individual cities don’t have much data and it’s preferable to group them together.
We’ll use data from the latest scraping run available now, which may have a slightly different date (by a few days or months) from city to city, but we don’t expect substantial differences for our analysis - all data is in any case updated to summer 2025.
We calculate, for each of these cities the Gini index, considering all properties that each host has in that city (this detail is important!).
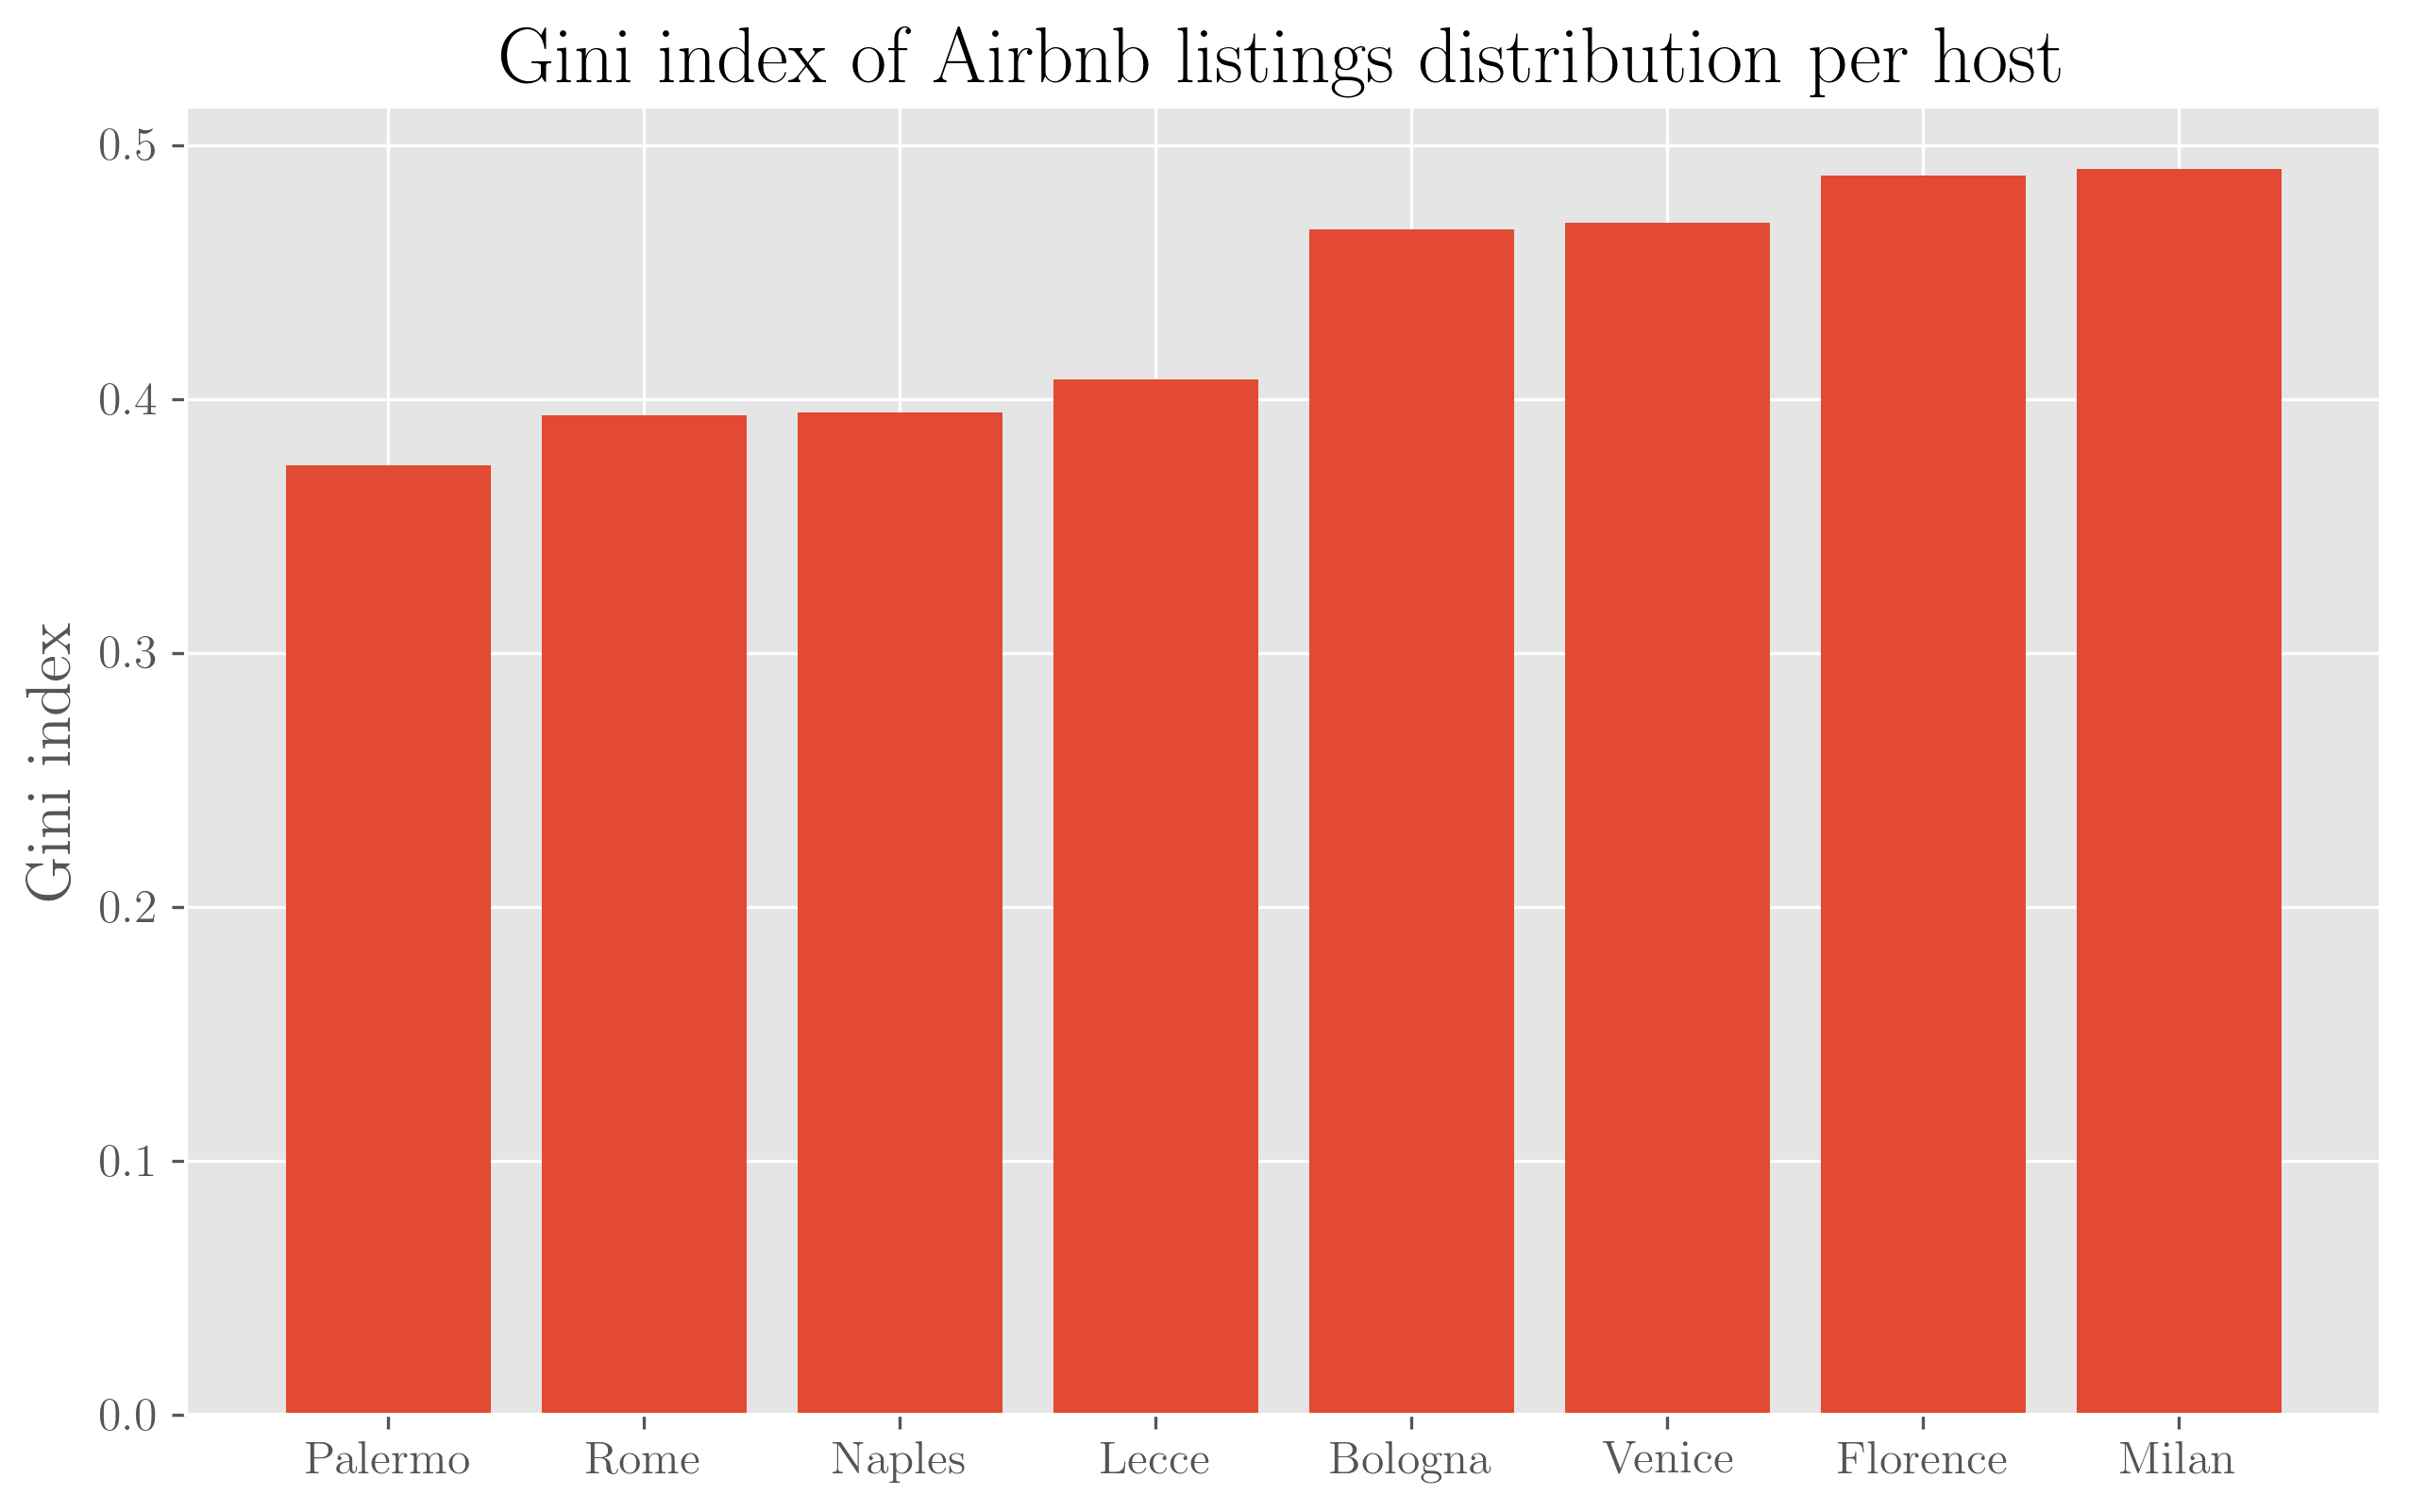
All cities are unequal, but each is unequal in its own way (semi-quote). Palermo appears as the least unequal, Milan the worst, although the difference between their Ginis is not that dramatic. Obviously, these are quite different cities in terms of size and population, but also, probably, tourist volumes.
We expect that everywhere there are agencies that either manage Airbnbs on behalf of individual owners and therefore group them together, or directly own them, so most likely the largest hosts are not individuals; let’s see who they are. It’s worth noting that if they are agencies, they don’t necessarily operate only in the territory of the city in question, their inventory could list accommodations everywhere, and this is something we’ll investigate later - the results of this post refer only to properties that a host has in the city itself.
| City | Total Airbnbs | % Airbnbs of largest host |
|---|---|---|
| Palermo | 7600 | 2.8% |
| Rome | 36309 | 0.7% |
| Naples | 10669 | 1.3% |
| Lecce | 2213 | 2.2% |
| Bologna | 4642 | 3.9% |
| Venice | 8590 | 1.7% |
| Florence | 13043 | 1.9% |
| Milan | 22540 | 2.1% |
In the table, the number of rental properties on Airbnb for each city alongside the percentage that the largest host has in that city. You can see that there are sensible differences in terms of total number of accommodations though it’s still several thousands for each city, and that the percentages are quite different, Bologna has almost 4% of accommodations in the hands of the same host, Rome only 0.7%. Let’s now see who these hosts are!
Who are the largest hosts
They are all agencies (i.e., not individual owners), which is not surprising, given the numbers.
- Bologna: “Wonderful Italy Emilia-Romagna”, which describes itself as the largest vacation rental group in Italy, with a portfolio of 2400 homes in different parts of the national territory - in Bologna they have 182
- Palermo: the same group in its regional branch, “Wonderful Italy Sicily” - in Palermo it has 216 accommodations
- Lecce: “Barbarhouse SRL”, another agency that has 49 accommodations there (Lecce is the city with the fewest accommodations of all those we have, a number significantly lower than the others)
- Milan: “Italianway”, which declares to operate in different parts of Italy, in Milan it has as many as 480 accommodations
- Florence: “MMega Homes And Villas”, which has 242 accommodations there and also declares to operate in different destinations
- Venice: “Veniceapartment-com”, has 142 accommodations there and operates only in Venice
- Naples: “Dimorra”, with 137 accommodations there
- Rome: “IFlat”, with 244 accommodations there
In a subsequent post we’ll try to look at the territorial distribution of the largest groups. Another thing we’ll try to do is measure how things change if we separate individual owners from agencies.
The distributions of accommodations per host up close
If we group the number of accommodations per host into categories:
- 1 only
- 2 or 3
- between 4 and 10
- between 10 and 100
- more than 100
and we count the number of hosts that have these numbers of accommodations city by city, we get the results shown in this figure:
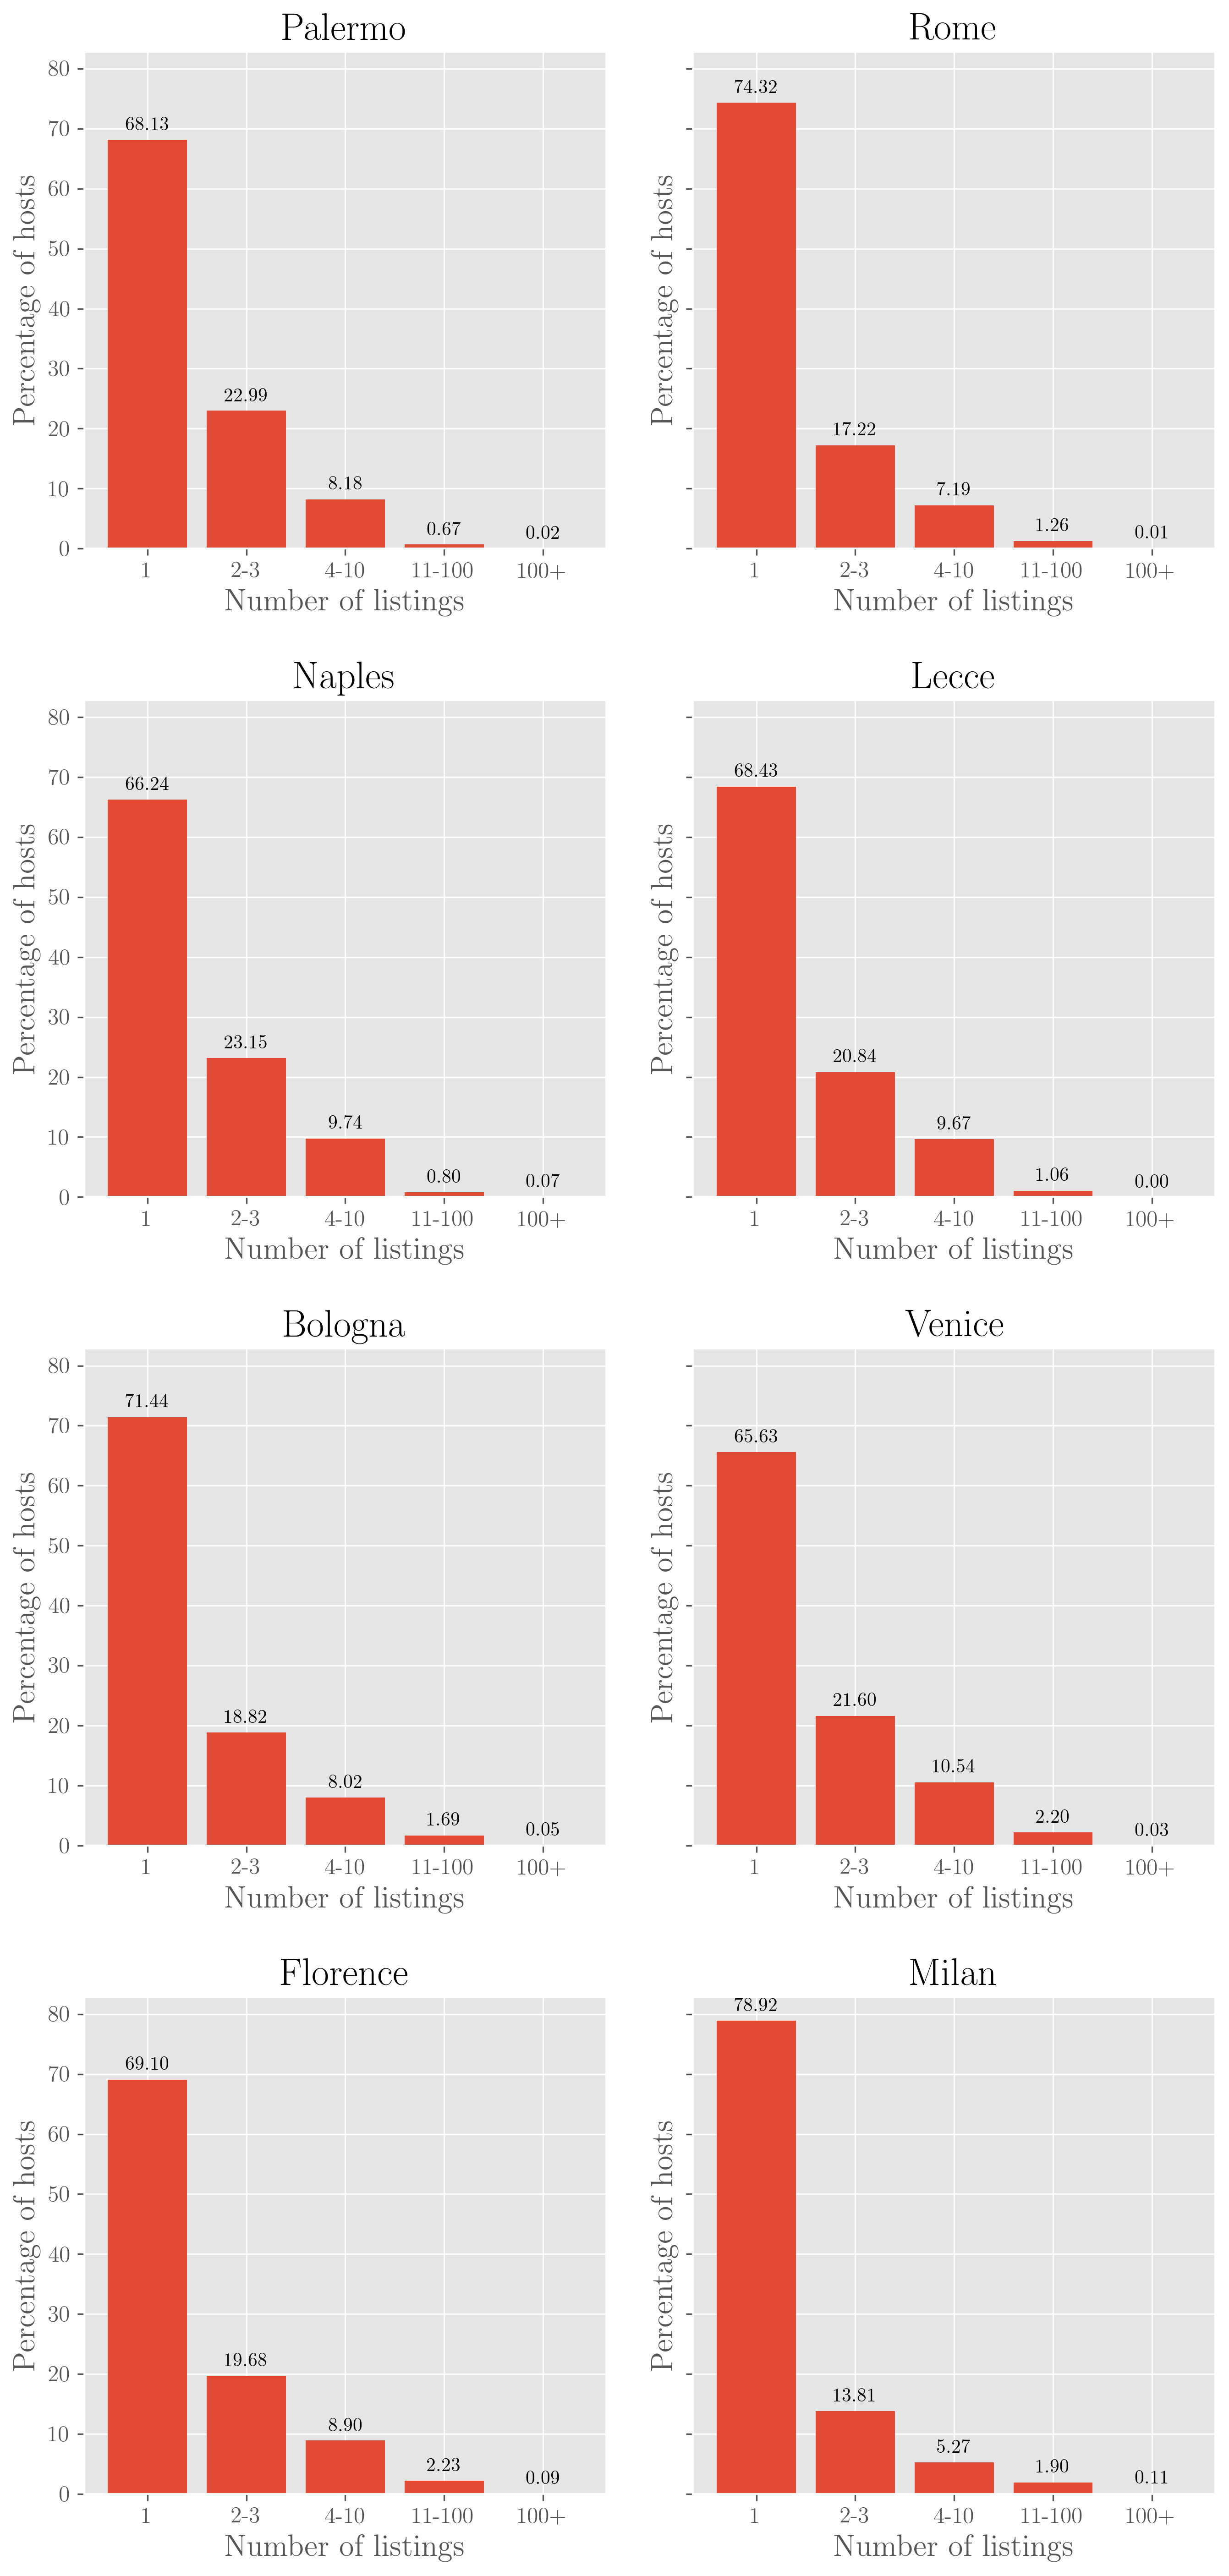
The distributions don’t change dramatically, but we see that Milan is the city with the highest percentage of single property owners (almost 79%, which in all likelihood will be individuals and not groups) and that only Lecce (as seen above indeed) has no owner with more than 100 properties.
We’ll continue this type of analysis in subsequent posts, see you next time!
Subscribe via RSS